This page allows you to manage the toolbars used to access Serial Monitor
commands.
There is a list of available application commands displayed in the
Commands list. You can filter it by categories, selecting the
required category in the Categories list. If you select the
All Commands category, you will see the complete list of
commands. Each command is displayed together among with the corresponding small
image, so you can easily locate the command you want to customize.
When you select the command, its description is displayed to the right.
There is a list of currently configured toolbars. You can create new
toolbars, delete existing ones and turn toolbars on/off. You can change the size
of the buttons on the toolbar using the Large buttons option.
You can click any command in the list and drag it to the toolbar where you
want it to be. To delete the button, click it on the toolbar and drag away from
it. To move the button, click it and drag to the another position.
Press the Reset All button to revert to the original toolbar
configuration.
When you press the New or Delete buttons or
drag buttons, the configuration changes, to save it, press the Apply
or OK button. If you press the Cancel
button, the previous configuration (the one that existed before the dialog
appeared) will be restored. If you press the Apply button and
then press the Cancel button, the configuration will also be
restored.
Note: You can also customize toolbars without ever displaying this
dialog. Press and hold the Alt button and drag buttons on the toolbar to
move or delete them.
Showing posts with label Seral Monitor. Show all posts
Showing posts with label Seral Monitor. Show all posts
Friday, February 19, 2016
Using the Serial Monitor
After the Serial Monitor is successfully installed, it can be launched from
the Start menu. Upon launch, the Serial Monitor tries the following:
When you close the Serial Monitor, the following happens:
When using Log Source, press the Skip button on the status bar to stop waiting for the next event and process it.
- It first tries to open the SerMon.sys device driver.
- If the previous attempt fails, it looks the Service Control Manager database for the driver and tries to start it. This attempt will fail if the current user is not the member of the Administrators group or isn't assigned the special privilege.
When you close the Serial Monitor, the following happens:
- The Serial Monitor closes the current monitoring session, allowing you to save its state.
- The Serial Monitor closes the handle to the SerMon.sys device driver.
- If the Serial Monitor security is set to default configuration, it stops the SerMon.sys device driver and unloads it. (See Security Settings for more information)
To temporary stop data processing:
To resume data processing:
When using Log Source, press the Skip button on the status bar to stop waiting for the next event and process it.
Common Settings Serial Monitor Configuration
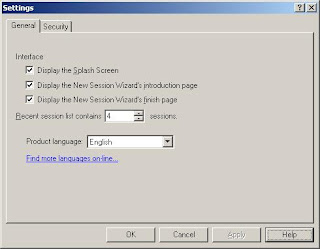
Common Settings page is accessed via the Tools|Settings menu option.
You have to select the General tab of the Settings property sheet. The
following window will appear:
- Display Splash Screen on startup
- Select this option to show the Splash Screen every time you launch the Serial Monitor.
- Display the New Session Wizard's introduction page
- Select this option to display the introduction page every time you start the New Session Wizard.
- Display the New Session Wizard's finish page
- Select this option to display the finish page every time you finish the New Session Wizard.
- Recent file list contains N sessions
- This option allows you to control the number of the last recently used sessions to hold in the File menu.
- Product Language
- Select the desired product language. All messages, commands, interface items and help file will be displayed in selected language. We often release new language packs.
Thursday, February 18, 2016
Security Settings Serial Monitor Configuration
Security Settings page is accessed via the Tools|Settings menu option.
You have to select the Security tab of the Settings property sheet. See
the screenshot below.
This page allows the system administrator to specify users who can launch the Serial Monitor and use its monitoring features.
Only local, domain administrator or a person with corresponding rights (write to the HKEY_LOCAL_MACHINE registry keys, install and manage device drivers) will get full access to this page. Everyone else will get read-only access to this page.
First of all, this window allows two configurations: default and multi-user.
Format Appearance Settings Serial Monitor Configuration
This page is used to change the appearance of Data Visualizers. It consists
of the following parts:
Category
Category
- This list contains all Data Visualizers whose appearance you can change. Select the desired category to modify it.
- Element
- This field contains the list of elements of the selected category. All elements are presented in the following field.
- Preview (large text box in the middle)
- Contains the preview for every element in the selected category. Consists of the element name and the element preview text. The selected element is highlighted. Element preview text is rendered exactly as it would in the real Data Visualizer. You can click on the preview text or the element name to change the selected element.
- Font
- This button displays the selected font for the element and allows you to change it. Press the button to change the current font.
- Color (button with a color box in the middle)
- This button displays the color box of the selected color for the current element. Press the button to change the color.
- Reset Category
- Press this button to reset the selected category to its original state.
Find Serial Monitor Configuration
You can search for a specified text in all Serial Monitor visualizers. To
start the search, select the Edit|Find... menu option or press the  button on the toolbar. You will see
the following dialog box:
There is a default keyboard shortcut Ctrl+F which can be used to execute this command.
Enter the phrase to search or select the one of the previously used phrases from the drop-down list box. Specify the search options (see Options below) and the search range. You can search either within the whole window or within the current selection. Press the Find Next button to start search or Cancel to close this window and cancel the search.
When you found the occurrence of the specified phrase, you can look for the next one. Select the Edit|Find Next menu option, or press the F3 to execute this command. button on the toolbar. There is a
default keyboard shortcut
 button on the toolbar. You will see
the following dialog box:
button on the toolbar. You will see
the following dialog box:There is a default keyboard shortcut Ctrl+F which can be used to execute this command.
Enter the phrase to search or select the one of the previously used phrases from the drop-down list box. Specify the search options (see Options below) and the search range. You can search either within the whole window or within the current selection. Press the Find Next button to start search or Cancel to close this window and cancel the search.
Options
- Check the Match whole word only option to search for the whole word. The word must be separated from the surrounding text by spaces, tabs or one of the following characters: . , ' " \ ( ) / + - * # @ ! ? = : ; < > { } [ ] & $ ~ |
- Check the Match case option to match the entered phrase exactly, including the characters case.
Find Next Occurrence
When you found the occurrence of the specified phrase, you can look for the next one. Select the Edit|Find Next menu option, or press the F3 to execute this command.
 button on the toolbar. There is a
default keyboard shortcut
Sunday, September 20, 2015
Configuring Log File Playback
This New Session Wizard page is used to configure the Log File
Playback.
Use the following procedure to configure the Log File Playback:
Use the following procedure to configure the Log File Playback:
- Specify the name of the log file you are going to use as the source. You can either select the name of the file in the dropdown combobox or use the Browse button to bring up the Open File dialog.
- Select the data stream within the selected log file.
- Specify the time range you want to be used. You can use either the time controls or locate the range times on the line.
- Specify the time scale you want to be used. You can play back the contents of the stream 16 times slower than the original, 8 times slower, 4 times slower, 2 times slower, 2 times faster, 4 times faster, 8 times faster or 16 times faster. There are also two special options, Stepped is for confirmation of each separate request and Continuous is to play back the whole contents of the stream without any pause.
- Press the Next button.
Wednesday, September 16, 2015
Configuring Protocol Analyzer
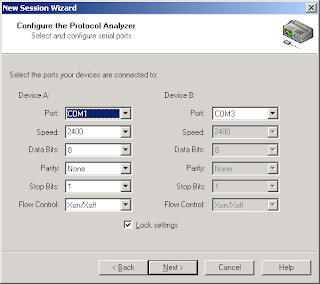
This New Session Wizard's page is used to configure the
Protocol Analyzer.
You configure the port settings of both devices, device A and device B. You set up the port the device is connected to, its speed, the number of data bits, the type of the parity, the number of the stop bits and the type of the flow control.
Lock settings switch can be used to synchronize all settings between devices, except for the number of the port. It is usually mindless to switch it off unless you have some non-standard devices. In this case you can use the Serial Monitor to connect two devices with different serial line requirements.
Configuring Data Processing
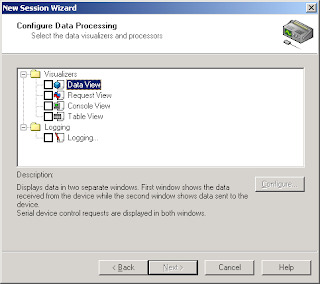
The last page of the New Session Wizard is used to select the number
of Data Visualizers and other data processors you want to display data in your
monitoring session.
Tuesday, September 15, 2015
Managing Monitoring Sessions Monitoring Session State
Monitoring Session State includes the following:
- The Monitoring Session Type, selected Data Source and its configuration.
- Data Processing settings, including:
- Data Logging settings
- Data Visualizers, their state and their windows position.
Managing Monitoring Sessions Saving Monitoring Session
Use the following procedure in order to save the monitoring session:
If the current session is brand-new and you select the File|Save Session menu option, it's behavior will repeat the File|Save Session As menu option behavior.
To save the current monitoring session under its current name:
- Select the File|Save Session menu option or press the
button on the toolbar.
- The session will be saved.
To save the current monitoring session under the new name:
- Select the File|Save Session As menu option.
- Enter the name of the file to store the session in.
- The session will be saved.
Tips
There is a keyboard shortcut to access the File|Save Session menu option. Press Ctrl+S key combination to execute this command.If the current session is brand-new and you select the File|Save Session menu option, it's behavior will repeat the File|Save Session As menu option behavior.
Managing Monitoring Sessions Closing Monitoring Session
Use the following procedure in order to load the monitoring session:
If there is an open monitoring session in the Serial Monitor, you will be asked to close it before continuing. If you decline it, you won't be able to load new monitoring session.
You can use Drag&Drop to open monitoring sessions. See Shell Integration section for more information.
There is a list of last recently used monitoring sessions in the File menu. You can select the file from that list to open it.
- Select the File|Open Session menu option or press the
button on the toolbar.
- Open File dialog will appear. Enter the name of the session file or choose it from the list.
- The selected session will be opened and the monitoring session state will be restored, including all windows positions.
Tips
There is a keyboard shortcut to access the File|Load Session menu option. Press F3 or Ctrl+O key combination to execute this command.If there is an open monitoring session in the Serial Monitor, you will be asked to close it before continuing. If you decline it, you won't be able to load new monitoring session.
You can use Drag&Drop to open monitoring sessions. See Shell Integration section for more information.
There is a list of last recently used monitoring sessions in the File menu. You can select the file from that list to open it.
Managing Monitoring Sessions Closing Monitoring Session
Use the following procedure in order to close the current monitoring
session:
The current monitoring session will automatically be closed when the Serial Monitor application is closed.
The serial port, the Serial Monitor is attached to, must be closed before closing Monitoring Session. That means that you have to close the application that uses the port.
- Select the File|Close Session menu option or press the
button on the toolbar.
- The Serial Monitor will stop data processing and will attempt to close the session. See Notes below.
Tips
There is a keyboard shortcut to access the File|Close Session menu option. Press the Ctrl+Shift+F4 button to execute this command.The current monitoring session will automatically be closed when the Serial Monitor application is closed.
Notes
There are some requirements that must be met in order to successfully close the monitoring session:The serial port, the Serial Monitor is attached to, must be closed before closing Monitoring Session. That means that you have to close the application that uses the port.
Managing Monitoring Sessions Shell Integration
In addition to the standard procedure of opening monitoring sessions
(described in Loading Monitoring
Session section), there are several other ways of doing the same thing:
- Drag the Monitoring Session file from Explorer to the open Serial Monitor main window
- Double-click the Monitoring Session file in the Explorer to launch the Serial Monitor and open the session
Friday, September 11, 2015
Data Logging Log Files
The Serial Monitor Log Files are LogIt! log files with lgs extension.
They can contain different data streams. Each stream contains all data monitored
during one monitoring session. Each event is associated with some time stamp, so
you can recreate the sequence of events very precisely.
The Log Files are compressed that allows them to hold more data while requiring less hard disk space. The Log Files are computer-independent and can be easily transferred to other computers by means of any kind of communication.
To play back information stored in one or another stream within the log file, you have to use a special kind of monitoring session.
See Also: Playing Back Log Files.
Data Logging Configuring Data Logging
When you create a new monitoring session you have an option to log all the
data monitored to the log file. In order to do it, enable logging in Data
Processing New Session Wizard page. The following window will appear:
Data Logging Playing Back Log Files
To play back the log file follow this procedure:
There can be long delays between recorded events. In this case another progress bar and the Skip button will be displayed on the status bar. You can press the Skip button to skip the delay and go directly to the following recorded event.
- Open New Session Wizard as described in Creating New Monitoring Session.
- Select the Log File Playback session type and press the Next button.
- Configure the session source as described in Configuring Log File Playback.
- Select required Data Visualizers as described in Configuring Data Processing. The corresponding wizard's page will not contain the Logging category when you select the Log File Playback session type.
- Press the Finish in the wizard. Playback will be started
There can be long delays between recorded events. In this case another progress bar and the Skip button will be displayed on the status bar. You can press the Skip button to skip the delay and go directly to the following recorded event.
Data Visualizers Data View Configuration
The Data View visualizer does not have its own configuration page but instead
of this it adds formatting categories into the standard appearance
configuration page. See its description for more details.
Data View category with IO Requests Text, Data Read and Data Written elements can be used to change the appearance of the Data View window.
The appearance of the hex data block can be configured using the Edit|Hex Data Display... menu option.
Data View category with IO Requests Text, Data Read and Data Written elements can be used to change the appearance of the Data View window.
The appearance of the hex data block can be configured using the Edit|Hex Data Display... menu option.
Data Visualizers Request View Copying/Exporting View Contents
The Request View contents can be copied/exported in any of the following
formats:
- UNICODE Text File
- ANSI Text File
- HTML File
Please note, that the list above is sorted in such a way that the topmost file format is generated faster.
Monday, September 7, 2015
Data Visualizers Console View Description
This Data Visualizer works as the text console, showing all the received data
as ASCII characters.
Here is a screenshot of the Console View window:
Here is a screenshot of the Console View window:
Subscribe to:
Posts (Atom)


